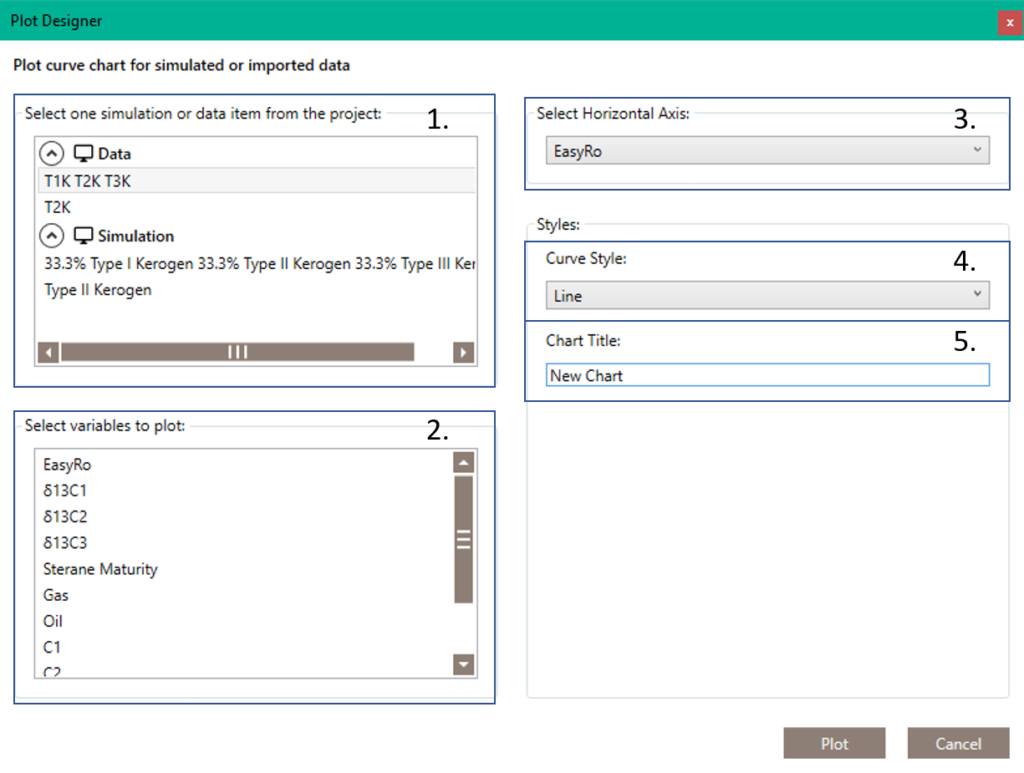
You can manually plot data from Simulation and Imported Data by clicking Plot > Plot in the Menu Bar or Plot in the Tool Bar.

Step 1: Select the simulation or data item from which to plot data from
Step 2: Select the variables to plot. Click each item to add or click on it again to remove the selection
Step 3: Select the variable for the horizontal axis
Step 4: Select the type of chart to generate – line, scattered points, line with markers, or stacked area
Step 5: Name your chart