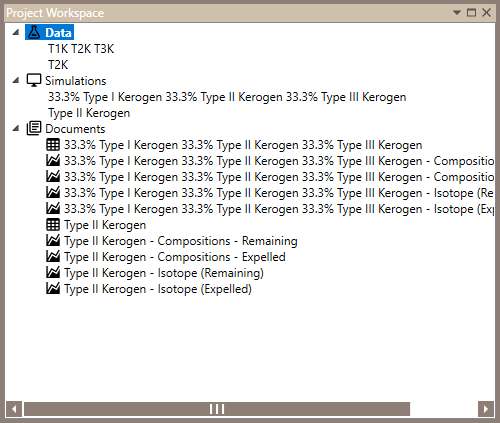
After your simulation has been generated, the Data Table and the Gas Isotope Expelled Chart will open as new tabs in the Document Panel. The simulation and associated documents will appear in the Project Workspace.

- Data – lists imported data
- Simulation – lists all of the simulations generated in the project.
- A report of simulation parameters is generated for every simulation. This report can be accessed by right-clicking the simulation > Show Report.
- When you delete a simulation, all associated documents will be deleted as well.
- Documents – lists all charts in the project. Open a document by double-or right-clicking. Right-click to remove a document from the list.
- The following charts are generated with each simulation:
- Gas Isotope Remaining
- Composition Remaining
- Composition Expelled
- The following charts are generated with each simulation: