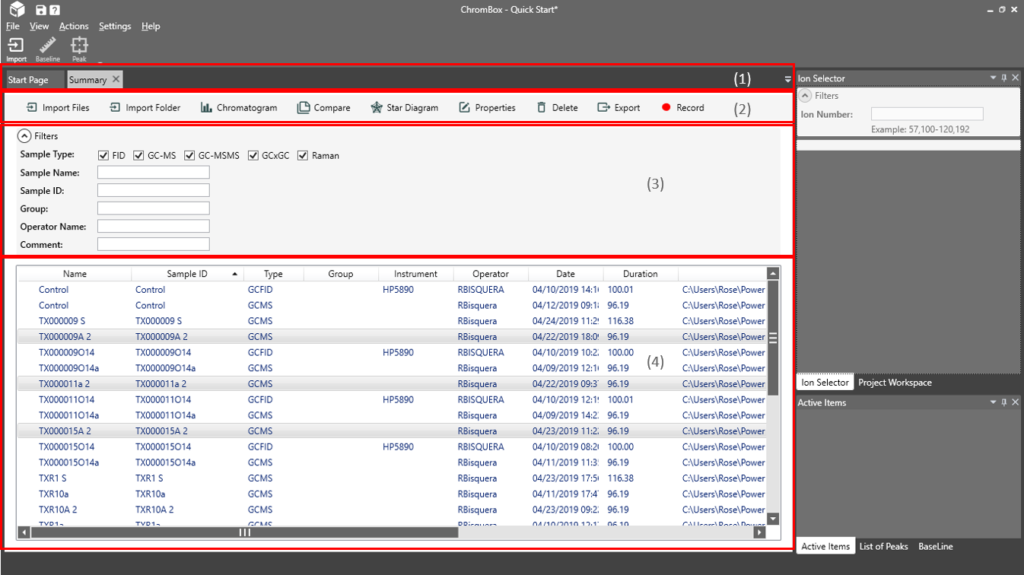
1. Document Tabs
2. Summary Tool Bar
- Import Files and Import Folder
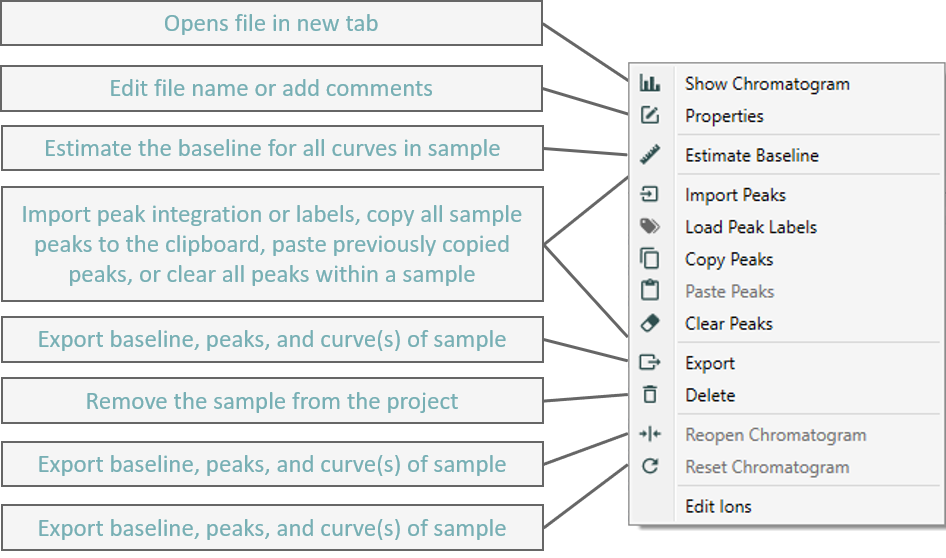
- Show – opens selected chromatogram(s) in new tab(s)
- *Compare – opens selected chromatograms into a single window (see Part 6.3)
- *Star Diagram – Data analysis tool (see Part 7.1)
- Properties – edit the name of the sample or add comments
- Delete – removes the selected chromatogram(s) from the project
- Export – creates .csv or .cbs files containing the chromatogram curve(s), baseline, and peak identification for the selected chromatogram(s). These files can be imported into new projects.
- CSV – save the curve(s), baseline, and peaks as separate files. For GCMS samples, each file will be labeled with the ion it pertains to.
- CBS – save the curve(s), baseline, and peaks in a single file using a ChromBox specific file format.
*Note: Compare and Star Diagram will only appear in the Summary Tool Bar if multiple samples are selected.
3. Filters – filter which file(s) appear in the sample window
4. Sample Window – lists the samples within the project. Right click on a sample for the following menu:

