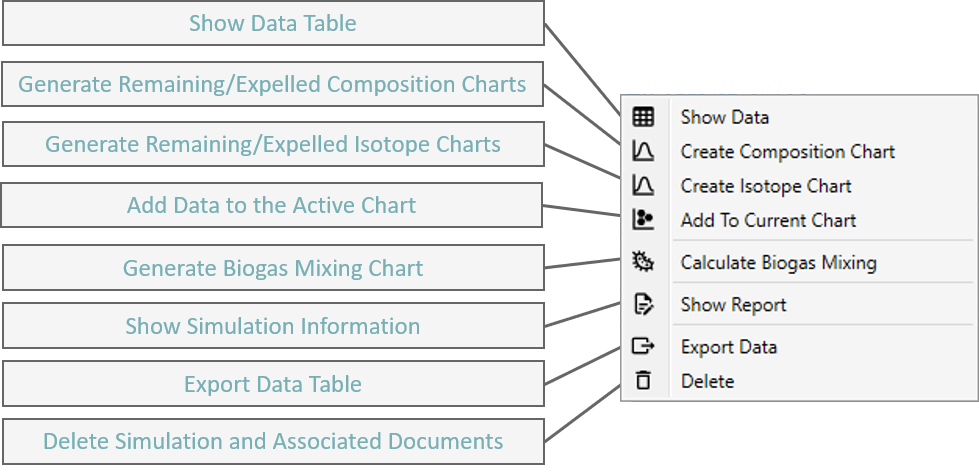
As mentioned in Part 4.1, simulated data will appear in, and can be opened from, the Documents section of the Project Workspace. Right-click the simulation in the Project Workspace for the following menu:

Note: Create Composition (or) Isotope Chart will either generate duplicate charts or regenerate charts deleted from the Documents section. Biogas will be discussed in depth in Part 5.1