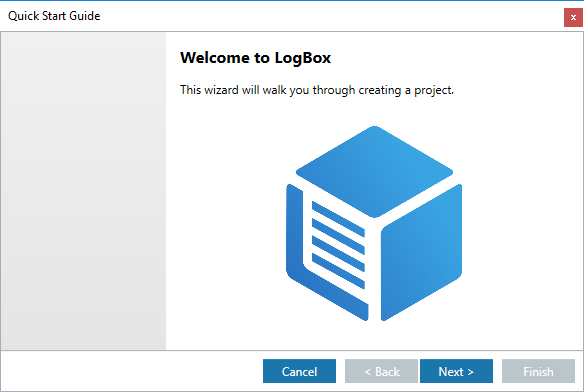
Congratulations on choosing LogBox. This Quick Start Tutorial demonstrates how fast and easy it is to manage your valuable data, build log plots, and add interpretations.
Part 1: Get Familiar with the Main Window
Launch LogBox through Start Menu or the desktop shortcut. The main window of LogBox contains 4 principal sections shown below:
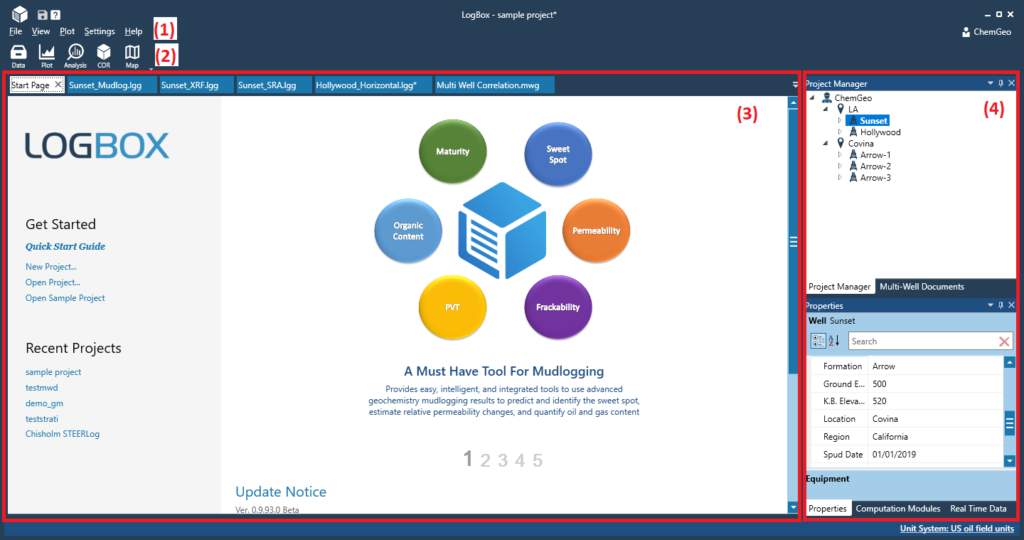
- (1) – Menu bar. Most of the functions can be accessed here.
- (2) – Tool bar for frequently used tools.
- (3) – Document panels. Most of the plots and data tables are organized here. The Start Page is shown here on start up by default.
- (4) – Tool panels, such as Project Manager, Multi-Well Documents, Properties, Computation Modules, etc.
Part 2: Create Your First Project
Click the Quick Start Guide link on the Start Page to start the guide. Follow the steps to create your first project. If closed, the Start Page can be opened from the View menu on the main window.
Part 3: Import Data
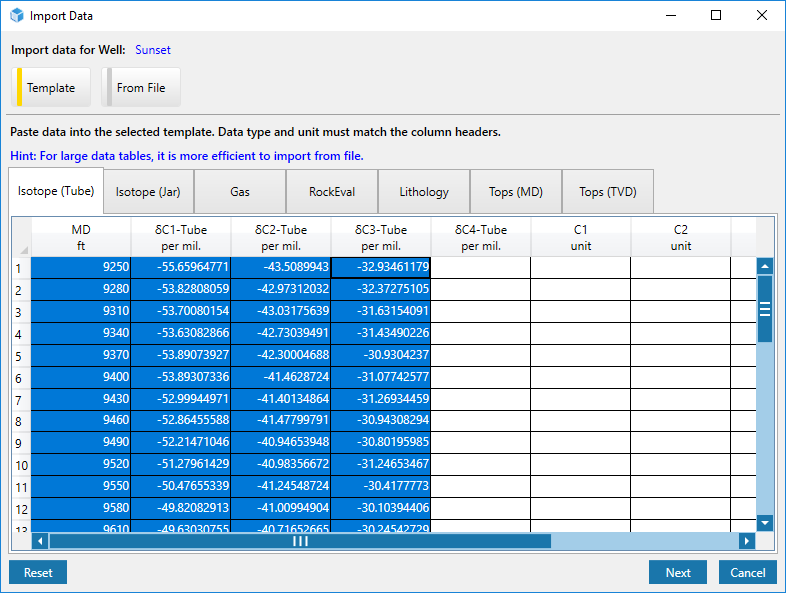
Once the Finish button in the Quick Start Guide is clicked, a new project is created, and the Import Data dialog pops up for data importing. There are two options for data importing, by template or from file, that can be switched by clicking the buttons in the top part of this dialog. Example Data.xlsx in Documents\ChemGeo\LogBox\Examples folder is used in this tutorial.
- Option 1: Import data by template. Find the data types that you want to import by navigating through the tabs, then paste through clipboard from contents in Example Data.xlsx. The sequence of the columns can be dragged to match the formats in your data sheets.
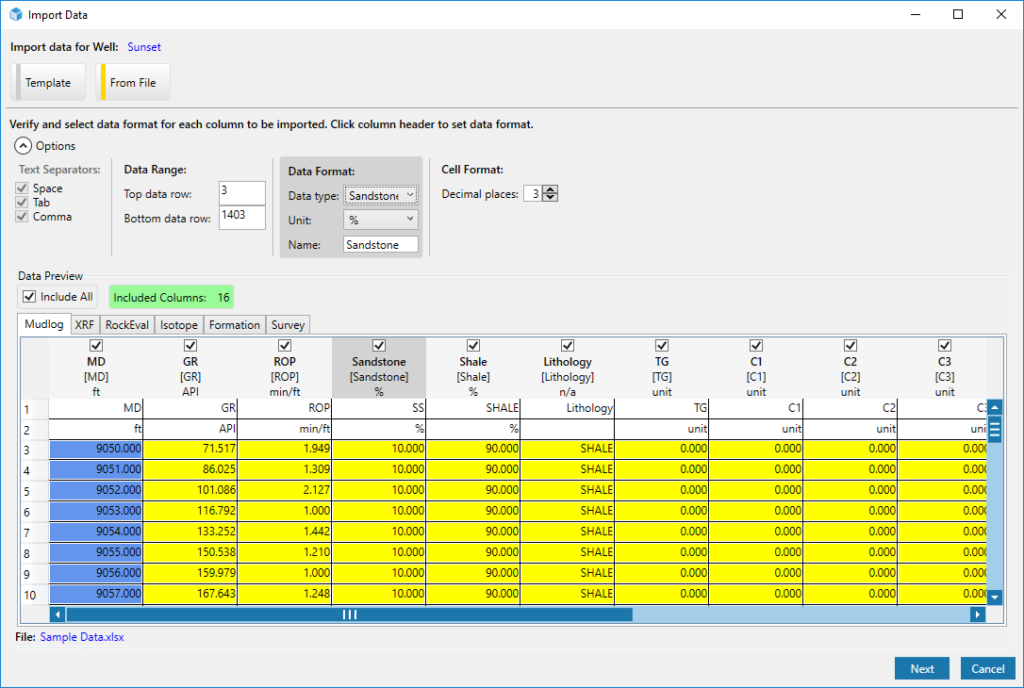
- Option 2: Import data from files. Click From File button, select Example Data.xlsx and click Open. The data in the file is displayed in the Data Preview section. Select the tab to be imported. In the Data Range section, confirm the range of rows to be imported, which is automatically identified. Select or deselect columns to be imported through the check box in each column header. The data type and unit of each column is automatically identified and displayed in the column header. If they are inconsistent with the file, click the column header, which will be marked gray, and modify the properties in Data Format section.
Part 4: Validate Data
Upon Next button is clicked, Data Validation dialog will show up. If there are invalid data entries, edit the cells or use the Data Filters. Click Import to finish.
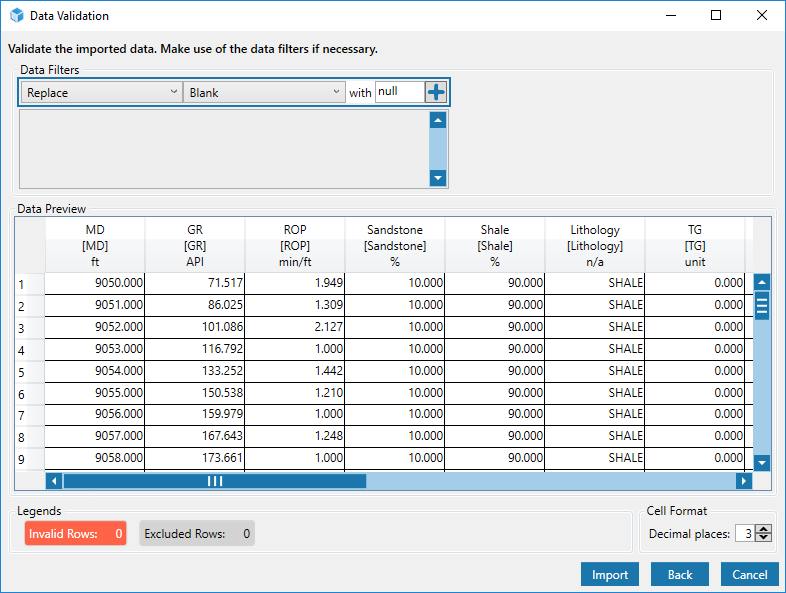
Repeat Part 3 and Part 4 until data in all the tabs in Example Data.xlsx is imported.
Alternatively, open the Sample Project by clicking on the Open Sample Project link on Start Page, in which data is already loaded.
Part 5: Plot a log
The following steps are based on the ‘Sunset’ well in the sample project.
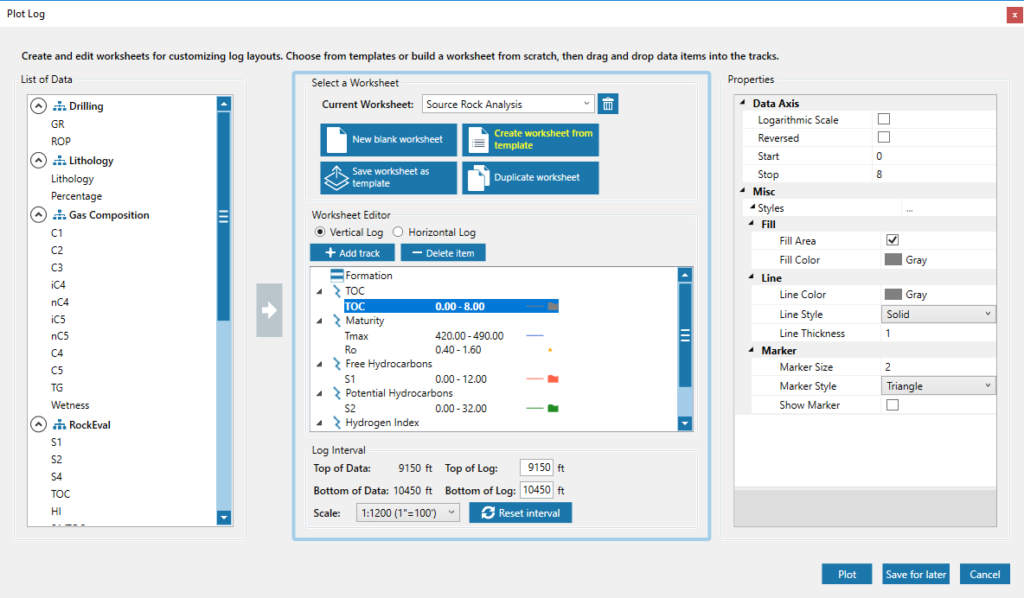
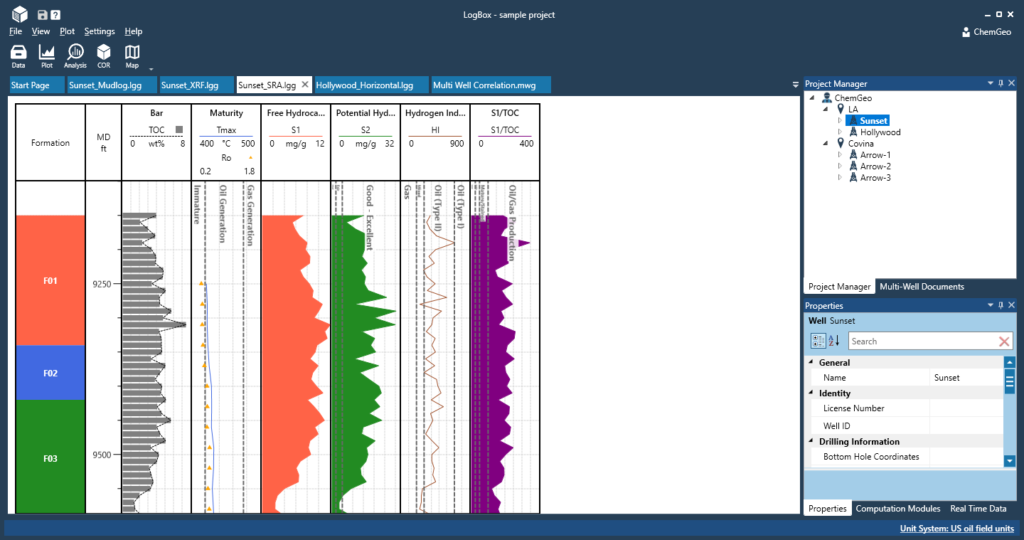
Select the ‘Sunset’ Well in Project Manager, then click Plot button in the toolbar. In Plot Log dialog, a worksheet is to be created to specify the data items, layout, and styles in a log plot. Click Create worksheet from template button, select Source Rock Analysis template and click OK. The data is automatically populated into the worksheet for a source rock analysis log. Click Plot to plot the log.
The log plot is to be shown in the Document Panel.
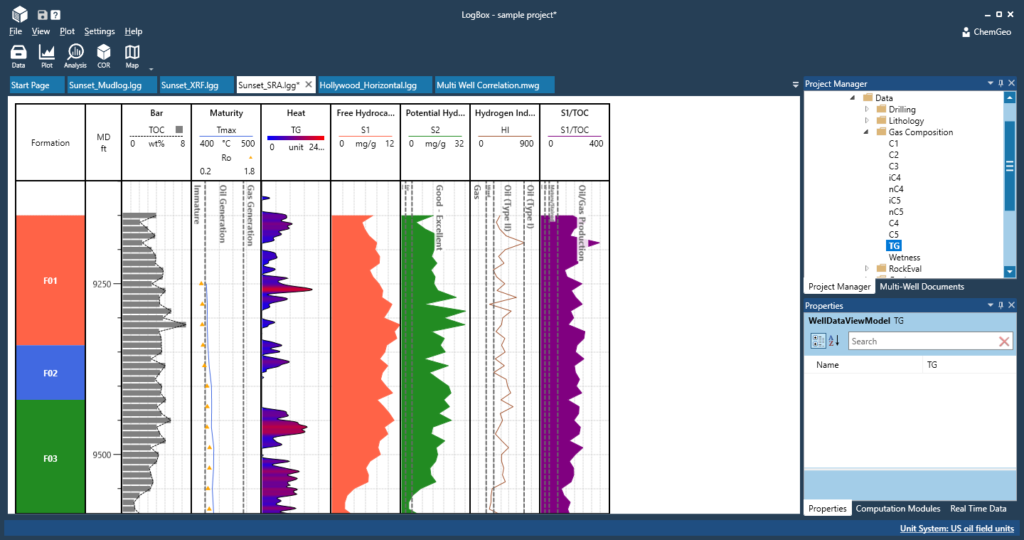
To add more contents to a log plot interactively, for instance, right-click on the ‘Maturity’ track, select Add Empty Track. Drag Gas Compositions > TG (Total Gas) from ‘Sunset’ well node in Project Manager and drop onto the new empty track, TG is then added to the log plot as a curve. To view it in different styles, right-click the TG track, select Convert Track To > Heat Track, e.g.
Part 6: Add Analysis Charts
LogBox offers intuitive and highly interactive tools for quick analysis of the data using type curves or templates. Optionally, select some zones of interest on the log by dragging boxes with left mouse button and assign name and color for each. Click the Analysis button in the toolbar to show a dialog for selecting type curves and templates.
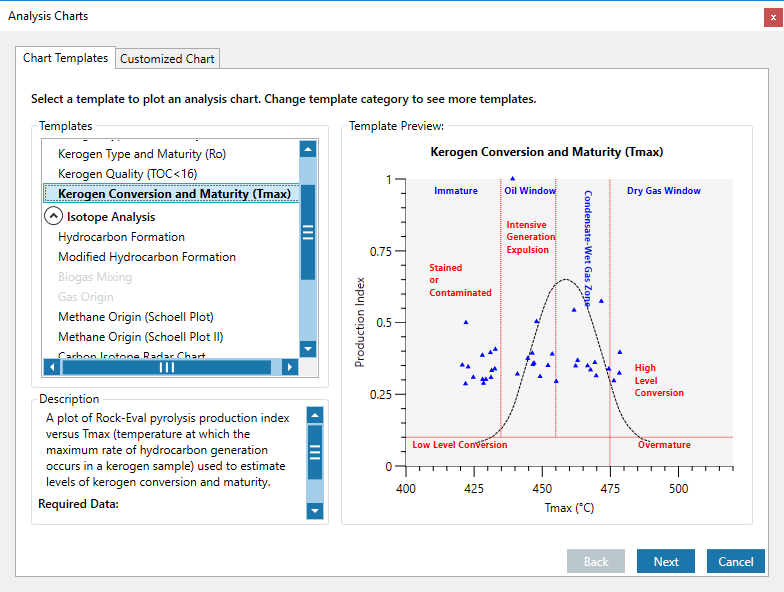
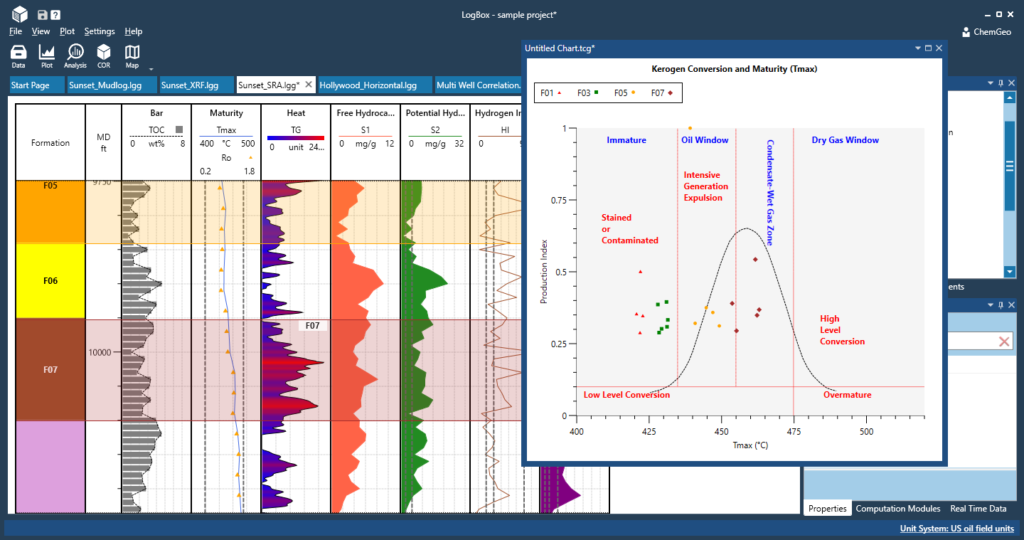
Data points will be automatically clustered by formation if no zones are selected. Add or resize zones as needed and the analysis chart is synchronized to reflect the changes.
Thank you for reading this tutorial. This is just a quick start for you to build your first project. More detailed guides for tools and useful tips are available in the following chapters.
